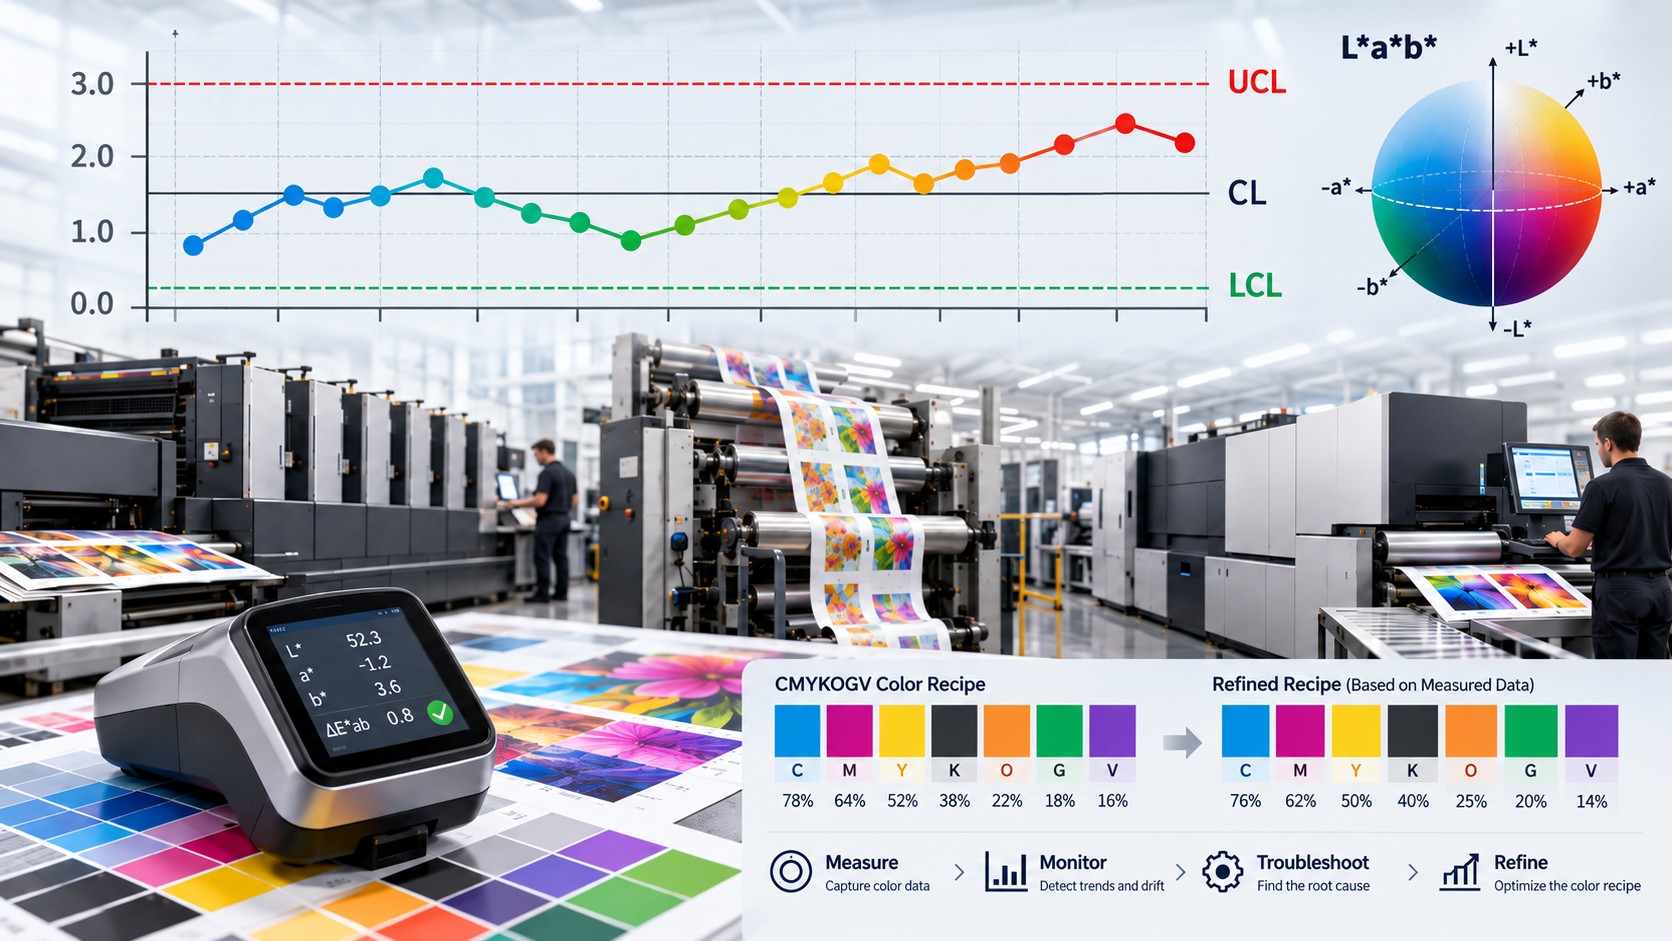
How SPC, CIELAB measurements, and CMYKOVG recipe optimization help identify color drift, find its cause, and maintain reliable reproduction in offset, flexographic, and digital LEP printing.
Ronen Dolev | Industrial Color Engineering Series | October 2026
When the Color Still Passes, but the Process Is Already Changing
A packaging plant is printing a long production run of colorful labels for an international brand. The job includes CMYK process images and a saturated brand color built from an expanded CMYKOVG ink set. At production startup, the primary colors and critical brand color are measured. All results meet the customer's requirements, and the run is approved.
Two hours later, the brand color is measured again. Its color difference has moved from ΔE00 0.8 to 1.4; subsequent readings reach 1.9 and then 2.3. The contractual tolerance is ΔE00 ≤ 3.0, so every sample still passes the conventional acceptance test. Yet the measurements show something more important than their individual status: the color is progressively moving away from its aim.
An operator examining only the latest reading may continue production because no specification has been exceeded. A color engineer examining the series may see evidence of a systematic change that deserves investigation. This is the practical role of Statistical Process Control (SPC). Routine product inspection asks whether the measured sample conforms. SPC asks whether the process remains predictable, whether variability has changed, and whether a special cause may have entered the production system.
The distinction becomes even more critical when color recipes are refined during production. Is an inaccurate CMYKOVG result caused by an unsuitable recipe, or did a previously approved recipe become inaccurate because the press no longer reproduces the condition in which it was qualified? Both problems can produce similar CIELAB deviations, but they require fundamentally different corrective actions.
Accuracy, Statistical Stability, and Process Capability Are Different Questions
Color accuracy describes the relationship between the printed result and a defined color aim. If the target and printed sample are specified in CIELAB, ΔE00 provides a perceptually motivated measure of their difference and can be compared with the customer's acceptance limit.
Statistical stability concerns the process's behavior over time: whether the observed changes are compatible with a stable system of common-cause variation, or whether a shift in location, spread, or data pattern suggests a special cause. Process capability then concerns whether a stable process can consistently satisfy the product specification under an appropriate statistical model.
A process may be highly stable while consistently missing its color target. A press returning ΔE00 around 3.5 against a maximum tolerance of 2.0 might be predictable, but its product remains unacceptable. Conversely, an entire set of readings can fall within tolerance while showing a sustained increase or a widening spread. Such a sequence can provide evidence of a process-control problem even before a defective sample is recorded.
It is therefore essential to separate specification limits, which express product requirements, from control limits, which are estimated from appropriately collected process data. A ΔE00 acceptance threshold of 3.0 is not an SPC control limit and cannot alone establish the natural variability or stability of a printing press.
Why ΔE00 Alone Is Insufficient for Troubleshooting
ΔE00 is valuable for judging color difference, but it gives the magnitude of a deviation rather than its direction in color space. Two samples can produce similar ΔE00 values even if one is too light and the other too dark; likewise, one sample may shift toward red while another shifts toward green.
Troubleshooting should therefore examine the signed CIELAB component differences. In this article, each difference is defined as the measured print value minus the target value. Positive ΔL* means that the print is lighter; negative ΔL* means darker. Positive Δa* indicates a movement toward red and negative Δa* toward green. Positive Δb* indicates a movement toward yellow and negative Δb* toward blue.
These directional data clarify the nature of the deviation without proving its physical cause. A rise in L* does not, by itself, demonstrate that ink film weight has fallen; substrate optics, measurement conditions, and transfer behavior can also affect the result. Likewise, a shift toward red does not automatically mean a multicolor recipe has too much magenta.
Where instruments and workflows retain spectral reflectance data, more detailed comparisons may reveal response changes that a single calculated color-difference value cannot localize. SPC analysis of signed components, or suitably designed multivariate or spectral indicators, can therefore complement ΔE00 acceptance testing.
Use the customer-defined color-difference metric to judge conformance. Use directional and process measurements to understand why the result changed.
Building an SPC System That Represents Real Production
A reliable SPC program begins with clearly defined printing conditions and a defensible measurement system, not a dashboard. Press, substrate, ink set, screening, color strategy, instrument setup, measurement backing, and sample state must all be traceable. A Phase I baseline should be collected under a process demonstrated to be suitable and sufficiently stable for statistical estimation.
Measurements from materially different operating states should not be pooled indiscriminately. Mixing glossy and matte substrates, different calibration aims, or different ink systems may inflate the estimated spread and conceal a meaningful local change. The sampling plan must also distinguish temporal variation from spatial nonuniformity: a press may have a stable overall average but unacceptable differences between the center and edges of a sheet or across the web.
Ideally, every data point should include a time stamp, measurement position, substrate identity, press condition, calibration revision, and relevant operational events. When measurements are taken close together, observations may be autocorrelated rather than independent. Applying classical chart limits without checking that assumption can produce false alarms or overlook genuine process movement.
The monitoring method should be chosen for the data and the engineering question. Shewhart charts are useful for relatively large departures or isolated unusual points; EWMA and CUSUM can be effective for detecting smaller sustained shifts. Multivariate SPC can monitor related color components together. Do not implement any of these methods with arbitrary limits simply because a control-chart template is available.
Particular care is required with capability indices. ΔE00 is nonnegative and may have a skewed distribution with only an upper specification limit. A conventional, normally distributed two-sided Cpk calculation should not be applied automatically. Depending on the data, an appropriate one-sided or non-normal capability analysis, percentile analysis, or direct estimate of nonconformance may be more defensible.
A Common Statistical Language Across Three Printing Technologies
SPC principles are technology-independent, but an observed signal must be interpreted through the physical mechanism that produces the printed image. Offset, flexography, and liquid electrophotography (LEP) differ in the controls available to the operator, the sources of variability, and the ways the process can be returned to a qualified state.
Offset Printing: Ink-Film Control and the Risk of Overadjustment
In offset printing, ink-film thickness, plate behavior, blanket transfer, substrate characteristics, and, for conventional wet offset, the ink-water balance influence color. Ink-zone adjustments can affect solid optical density, but they may also increase tone value (TVI), shift overprint relationships, and affect neutral balance.
A major SPC risk in this environment is overadjustment. If the operator responds to every small density fluctuation by moving ink keys, normal measurement noise and process delay can be transformed into larger oscillations. The sequence of density measurements must therefore be interpreted alongside ink-setting changes and the time required for the system to respond.
A persistent change confined to one ink zone suggests a different investigation from a change present across the entire sheet. Localized deviations point to local ink delivery and transfer; system-wide movement requires considering common variables such as ink condition, dampening, blanket behavior, and substrate response. SPC does not replace OD or TVI control. It helps determine when and where intervention is justified.
Flexography: Separating Ink Formulation from Transfer Behavior
In flexographic printing, anilox geometry and condition, ink rheology, plate behavior, impression, drying, and substrate properties influence delivered ink volume and tonal response. A change in viscosity or anilox transfer efficiency may alter both solids and composite colors, but their measurement signatures need not be the same.
Color data become more diagnostic when recorded alongside relevant process variables. A gradual brand-color shift occurring with a viscosity trend is a reasonable reason to investigate their relationship, but correlation alone does not establish cause. Other possibilities include pigment concentration, ink temperature, anilox contamination, drying conditions, and plate-to-substrate contact.
If the average color stays close to target while the spread across the web grows, the problem may be nonuniform transfer rather than a uniform change in formulation. Measurement positions, solid and tint patches, and independent checks of the ink-delivery system help distinguish these possibilities.
Digital LEP: Stable Output Can Conceal Increasing Correction Effort
Liquid electrophotographic printing depends on controlled electrostatic image formation, liquid-ink development, image-transfer behavior, substrate properties, and digital calibration. On supported platforms, embedded sensing and automated correction can help maintain the final printed color.
This introduces an important SPC distinction: stable output does not necessarily mean an unchanged physical state. A closed-loop color system may progressively modify its control parameters to offset a changing process. The measured ΔE00 values may remain near the target while the effort required to achieve that target increases.
Where correction magnitudes, calibration events, or control-state variables are accessible, they can be monitored alongside output-color data. A drift in correction demand may justify a press-health investigation, but it is not proof of mechanical failure. Compare it against a qualified baseline and interpret it in the context of the actual control architecture. Not all LEP systems expose equivalent data.
A calibration event also creates a meaningful time marker. Measurements taken before and after an adjustment should not automatically be combined into one uninterrupted statistical series. Verify whether the system returned to the approved reference state or entered a measurably different operating condition.
Refining a CMYKOVG Recipe from Measured CIELAB Deviations
Once SPC identifies a deviation, a separate decision is necessary: should the physical printing process be restored, or should the recipe itself be refined? If a previously approved brand recipe has drifted, the press condition comes first. Modifying the recipe to compensate for a temporary transfer or calibration problem can create a new mismatch as soon as the underlying issue is corrected.
If the process is verified stable and the recipe still misses the customer's target, the case is suitable for controlled color-recipe refinement. This is where signed CIELAB measurements become useful feedback for a multicolor optimization procedure.
Seven Colorant Channels Do Not Yield a Unique Three-Coordinate Solution
An expanded-gamut CMYKOVG ink system contains cyan, magenta, yellow, black, orange, violet, and green. Standard literature also uses the CMYKOGV channel ordering. However, the resulting color is commonly evaluated in three CIELAB coordinates. Therefore, more colorant variables are adjustable than colorimetric coordinates, and multiple ink combinations may produce nearly identical Lab values.
Consequently, no universal rule converts a Δa* or Δb* error directly into a fixed percentage adjustment to one channel. Increasing cyan can change a*, b*, and L* simultaneously; adding black may reduce lightness while also changing chroma. All effects depend on the other active channels, their overprint interactions, screening, substrate, and the recipe's position in the device's color space.
A robust workflow uses the known channel recipe and the press's measured local response, either from a valid multicolor characterization model or from controlled variation patches. Recipe selection must also respect constraints such as permissible total coverage, channel availability, number of active inks, smooth tonal behavior, and reproduction stability.
Step 1 — Measure the Signed Color Error
Assume that a customer has defined the following brand-color target and the stable press produces this result:
Coordinate | Target | Printed sample | Printed − target |
|---|---|---|---|
L* | 55.0 | 59.0 | +4.0 |
a* | +28.0 | +32.0 | +4.0 |
b* | −35.0 | −27.0 | +8.0 |
The print is lighter, redder, and less blue than the target. The intended movement in CIELAB space is therefore toward lower L*, lower a*, and more negative b*. These observations describe the desired colorimetric direction. They do not specify how many percentage points of cyan, magenta, violet, or any other ink to add or remove.
Step 2 — Select Relevant Colorant Degrees of Freedom
Start with the existing approved or proposed recipe and the separation strategy that generated it. A blue-violet brand shade may use cyan, magenta, violet, and perhaps black, but there is no reason to activate all of those channels automatically. The appropriate channels depend on the actual initial recipe, available gamut, and the controls implemented by the workflow.
The optimization problem is easier to control when the number of variables is deliberately restricted. For example, the engineering rules may limit active inks, preserve a preferred base channel, constrain total ink coverage, or penalize large deviations from a previously qualified recipe. These are not cosmetic settings: they determine whether the solution can be repeated reliably on press.
Step 3 — Print Measured Variations and Build a Local Response
A practical manual procedure prints a compact variation chart around the current recipe. Instead of guessing one large correction, vary the relevant colorants in small, controlled increments while keeping the press condition unchanged. Measure each candidate under the same instrument, backing, and M condition.
The measurements reveal how local changes in channel percentages affect the resulting CIELAB values. A multicolor model can use such response information to calculate the next candidate, while an operator can use the results to select a promising iteration. Where supported, iterative recipe-refinement software may automate this search.
The mathematical relationship is generally nonlinear, so a response estimated near one recipe should not be assumed valid for another part of the gamut or for a large composition change. Each proposed correction is a candidate requiring a new print-and-measure verification, not proof of success.
Step 4 — Evaluate Both Accuracy and Production Robustness
The following simulated example illustrates the outcome of several measured refinement iterations:
Recipe | L* | a* | b* | ΔE00 to target |
|---|---|---|---|---|
Target | 55.0 | +28.0 | −35.0 | 0.00 |
Original | 59.0 | +32.0 | −27.0 | 6.76 |
Variation A | 57.2 | +29.7 | −31.8 | 3.14 |
Variation B | 55.6 | +28.5 | −34.2 | 0.85 |
Variation C | 54.9 | +26.9 | −35.6 | 0.86 |
Illustrative data only; these are not measurements from an actual press trial. The ΔE00 values were calculated from the displayed CIELAB coordinates using the CIEDE2000 method. Small differences such as 0.85 versus 0.86 may be insignificant relative to measurement and process variation.
Variation B gives the lowest single measured ΔE00 in this example, but that alone is not sufficient reason to release it. Verify repeat prints, cross-sheet or cross-web behavior, relevant tint percentages, and any customer-critical viewing conditions. A recipe with a marginally higher initial ΔE00 may be preferable if it is demonstrably more robust within the agreed tolerance.
Can ΔLab Drive a Direct Numerical Recipe Correction?
Yes, provided a sufficiently valid model describes how changes in the selected device channels affect the printed color. Locally, one can estimate a response matrix linking small adjustments in active channel coverages to changes in L*, a*, and b*. A constrained optimization can then search for an ink adjustment that reduces color error while respecting process restrictions.
Because the system may be underdetermined, constraints or an optimization preference are essential. Reasonable engineering choices include keeping the correction small, minimizing coverage, restricting active channels, or favoring a stable, established separation. For jobs where appearance under multiple illuminants matters, spectral comparison may be needed because two recipes with similar Lab coordinates under D50 can be metameric.
The final numerical answer must still be printed, measured, and verified. Lab feedback guides a controlled iteration; it does not convert every multicolor recipe into a uniquely solvable three-variable equation.
Bringing Recipe Refinement Under SPC Control
A successful recipe adjustment does not end with one low ΔE00 measurement. A production-approved recipe should be evaluated for both closeness to the target and its repeatability over time. A candidate that is excellent at startup but drifts quickly may perform worse in production than one that is slightly less exact but consistently within the agreed tolerance.
For critical brand colors, consider monitoring the signed Lab components and the contractual ΔE00 acceptance statistic. Track the recipe revision and the time it was activated. Measurements from two different recipes or separation strategies must not be treated as observations from a single unchanged process without qualification.
Once a new recipe is approved, establish or verify its operating baseline and evaluate the sequence of repeat measurements. SPC can then identify whether that recipe's measured output remains predictable. Recipe refinement moves the nominal result toward target; SPC indicates whether that result remains reproducible in production.
Professional Troubleshooting: Should the Recipe or the Press Be Corrected?
The most damaging color-control mistake is to treat every out-of-tolerance patch as a request to change the ink percentages. First, classify the failure. A single failing brand color with stable process controls suggests a different investigation from multiple colors moving together, or a recipe that was previously correct but now reproduces differently.
The following matrix provides diagnostic starting points rather than automatic cause assignments:
Observed pattern | Possible investigation | Verification / corrective direction |
|---|---|---|
One brand color fails; process colors remain stable | Incorrect recipe, active-channel mapping, or spot-color conversion | Confirm original recipe and color strategy; refine the recipe under a verified press condition. |
Several brand colors drift similarly. | Press state, ink, substrate, calibration, or common workflow change | Check solids, tonal response, substrate, and job settings before altering individual recipes. |
ΔE00 rises progressively through the run | Physical process drift or changing calibration state | Analyze signed Lab trends, control-chart signals, and time-linked operational events. |
Average color is acceptable but spread grows | Unstable or spatially uneven color reproduction | Sample repeated time points and locations; distinguish spatial and temporal variability. |
L* changes while solid OD remains near aim | Substrate optics, measurement, transfer, or tonal response | Verify sample state and measurement setup; compare solids, tints, and substrate white. |
ΔE00 improves while CMYKOVG coverages change dramatically | Poorly constrained recipe optimization | Restrict active channels and large recipe changes; check ink and process limits. |
Solid brand color passes, tints fail. | Tone response or separation mismatch | Measure tonal ramps and active-channel interactions, not just the 100% patch. |
Color matches under D50 but differs under retail lighting | Illuminant metamerism | Examine spectral data and test relevant viewing conditions. |
Failure begins after a substrate or calibration change | A different printing condition or output response | Compare approved versus actual state before rebuilding recipes. |
Prediction passes, but printed sample fails. | Inaccurate multicolor model, changed condition, or unmodeled interaction | Print variation targets; reassess characterization and the actual process state. |
Case 1 — A Previously Approved Recipe No Longer Matches
Do not begin with a new formulation. Re-establish whether the press can reproduce the original qualified condition. In offset, examine ink delivery and transfer. In flexography, inspect ink condition, anilox transfer, and impression. In LEP, review calibration, substrate definition, and the relevant imaging and transfer conditions.
If the physical condition has changed, revise the production process first. Otherwise, a spot recipe created as compensation for a temporary fault can become inaccurate again after the fault is corrected. Only when the press baseline is verified should further recipe refinement be considered.
Case 2 — The Press Is Stable, but the Recipe Misses Its Aim
This is the appropriate setting for Recipe Refinement. Measure the color, compute signed Lab differences, and verify the participating channels and color strategy. Use model-based optimization or a controlled variation chart, keeping the print condition fixed. Measure the results and select candidates based on accuracy, coverage, stability, and relevant tint behavior.
If the requested target is outside the available device gamut, repeated small recipe changes cannot manufacture an unattainable color. Document the limitation and agree on an acceptable compromise, an alternative channel configuration, or another qualified production route.
Case 3 — A Corrected Recipe Passes Once but Cannot Be Repeated
Assess whether the process variation is large relative to the improvement being claimed. If repeated prints of the same recipe vary by as much as the expected color correction, a single favorable measurement does not establish that the new recipe is genuinely better. Use repeat prints and appropriate uncertainty evaluation before deciding.
Also examine the optimization step size. A large simultaneous adjustment across several channels can move the recipe beyond the region where the local response model is reliable. Smaller verified iterations are usually easier to diagnose and validate than one uncontrolled jump.
Case 4 — Primary Solids Pass but Composite Colors Fail
A failure confined to overprints or multicolor builds suggests an interaction that solid patches alone cannot reveal. In offset, investigate trapping, ink sequence, and transfer conditions. In flexography, evaluate overprint interaction, ink transfer, and drying. In LEP, check whether the multicolor model and selected output strategy represent the actual ink set and printing conditions.
Increasing the density of an already acceptable primary may create more problems than it solves. Before changing a stable baseline, determine whether the observed composite-color error is physical, tonal, or computational.
Qualifying a New CMYKOVG Recipe for Production
Approval should be based on more than a single color-difference result. First, verify the final color against its defined tolerance using the appropriate measurement and viewing conditions. Then assess repeatability across relevant positions and production intervals. Where the color appears in variable tint percentages, check the tonal progression rather than the full-strength patch alone.
For brands distributed through multiple viewing environments, evaluate spectral or multi-illuminant behavior when required. Preserve the recipe identity, seven-channel percentages, output strategy version, target values, measured results, substrate, press state, and release date. This information is essential for repeat production and for interpreting SPC signals after a later change.
Once qualified, the recipe becomes part of a controlled printing condition, not merely a set of percentages that happened to match one sample. Production monitoring should test whether that controlled condition continues to generate acceptable output.
Engineering Conclusion: Color Correction Is Not a Substitute for Process Control
Industrial color management must answer two linked but different questions: is the press process behaving as intended, and does the color recipe produce the intended appearance within that stable process? SPC helps detect changes in average response, variability, and process behavior. Signed CIELAB values indicate the direction of a colorimetric error. Constrained multicolor recipe optimization can select a better ink combination when the process is stable but the original recipe is inaccurate.
With seven CMYKOVG channels and only three CIELAB coordinates, no single universal percentage correction can be inferred from ΔLab alone. A defensible refinement requires a measured response model or iterative variation patches, engineering constraints, and independent verification of the printed result.
Offset, flexography, and LEP differ in how they deposit ink and control it. The decision logic remains common: validate the measurement, restore or confirm the production state, identify the type of color error, and only then make the correction that addresses its true cause.
The objective is not merely to achieve the correct color once, but to make both the recipe and the printing condition capable of reproducing it accurately and predictably throughout the product's production life.
Technical References
ISO/TS 21328:2022 — Graphic technology: Guidelines for multicolour printing characterization (CMYKOGV). https://www.iso.org/standard/70553.html
ISO 7870-2:2023 — Control charts: Shewhart control charts. https://www.iso.org/standard/78859.html
ISO 7870-4:2021 — Control charts: Cumulative sum charts (CUSUM). https://www.iso.org/standard/74101.html
ISO 7870-6:2024 — Control charts: EWMA control charts. https://www.iso.org/standard/83852.html
ISO 7870-7:2020 — Control charts: Multivariate control charts. https://www.iso.org/standard/69640.html
ISO 13655:2017 — Graphic technology: Spectral measurement and colorimetric computation for graphic arts images. https://www.iso.org/standard/65430.html
ISO 20654:2017 — Graphic technology: Measurement and calculation of spot color tone value. https://www.iso.org/standard/68668.html
NIST/SEMATECH e-Handbook of Statistical Methods — Statistical process control, control charts, and interpretation of process limits. https://www.itl.nist.gov/div898/handbook/pmc/section3/pmc32.htm
Professional research on expanded-gamut printing and iterative measured spot-color refinement; implementation details depend on the press, ink system, and DFE architecture.